The government competitiveness watchdog, part of the economy ministry, followed dozens of international classifications, as they can influence perceptions of the attractiveness of the country to foreign investors.
Francine Closener, the secretary of state for the economy, stated: “we must do everything for Luxembourg to be classified highly in these international benchmarks.”
Competiveness has been defined as:
“if its productivity increases at a similar or higher rate than its main trading partners which have a similar level of development, if it manages to maintain a balance in an open market economy and if it has a high employment rate.”
The Conseil économique et social defined it as:
“the capacity of a nation to improve the standard of living of its residents and to provide them with high levels of employment and social cohesion while preserving the environment.”
The five economic sectors which have been identified as priorities in Luxembourg are information & communications technologies, health sciences & technologies, eco-technologies and space technologies.
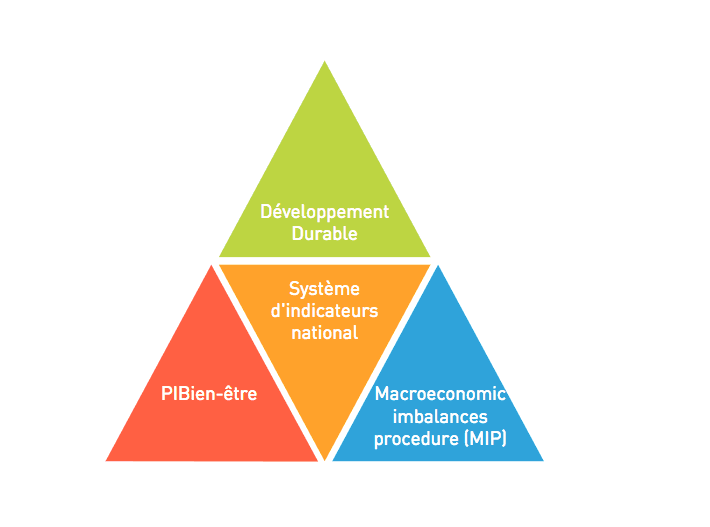
However, a new framework of indicators has been established to take into account the specificities of the country which these international benchmarks may miss. Out of the 67, 41 are new indicators. They take into account economic, social and environmental aspects of competitiveness.
Economic aspects
On the 25 indicators measuring the economic aspects, Luxembourg has 14 marked green, which indicates that the grand duchy scores 20% better than the EU average. These are: public debt, government balance relative to GDP (average over 3 years), market share of global exports over a 5-year average, external net creditor, real effective exchange rate over 3 years, real GDP growth (average over 3 years), inflation, yields on long-term government bonds, unemployment rate, average rate of global productivity of the factors for the whole economy, real productivity of work by hour worked (3-year average), nominal labour unit costs (3 year average), GDP/hour worked, and life-long learning.
At the same time, the number of red indicators has also gone up. These relate to: current account balance (3-year average) is 5%, the time necessary to set up a company, which is 16.5 days. Furthermore, the corporate tax rate is high at 29%, while the European average is 22%. The profitability of non-financial companies in terms of percentages stands at 5.9%, and Luxembourg is last in the European ranking.
Spending on R&D
Table: Gross national spending on research and development, in % of GDP, 2015

Luxembourg is below the European average on R&D spending in 2015, while the European objective is to spend 3% of GDP. The government has set the objective of between 2.3% and 2.6% of GDP by 2020. Between 1.5% and 1.9% will be allocated to the private sector and 0.7% and 0.8% to the public sector.
Employment in medium-high to high technological manufacturing sectors is only 0.8% compared to total employment, compared to 9.8% in Germany and 4.5% in Belgium.
In terms of education, in 2016, 54% of 30-34 year olds had a university degree. Luxembourg has fulfilled the objectives of reducing the number of early school leavers.
Macroeconomic imbalances
The EU has set up a procedure to follow internal and external macroeconomic imbalances after the financial and economic crisis.
The report contains the current data for 2017, which will be published in the next report on the alert mechanism by the European Commission in November 2017.
While Luxembourg overstepped the maximum level of the current account surpluses (+6%) between 2002 and 2012, the surplus has gone down since 2013.
Luxembourg has very volatile records in net international investment positions; however it has always been in surplus.
Table: Share of global exports (variation in % over 5 years)

There was a big decrease in 2012 in Luxembourg’s exports, but since 2013, its share is increasing again.
The European Commission has identified the risk of a real estate bubble if its deflated housing price index is higher than 6%.
Table: Housing prices index, deflated (variation in % over 1 year)

In Luxembourg, real estate prices have been continuously increasing since 2001, except in 2009. Between 2001 and 2006, Luxembourg overstepped the 6% mark. Since 2007, the annual increase of housing went back beneath that threshold. However, it has been edging very close to it again over the past 2 years.
The indicator of private debt is important, because excessive levels can endanger the financial stability of the country.
It measures the debt levels of non-financial private companies, households and charities (in % of GDP). The threshold is set at +133% of GDP.
Table: Private consolidated debt (in % of GDP)

Since this indicator has been measured in Luxembourg, it has consistently scored higher than the threshold. The report suggested that:
“taking into account the liquidity of financial markets and the experience in international transactions, a company can choose to take on a debt contracted in Luxembourg, but not for its own needs, but for another linked entity which can be based abroad (ex. intra-group credits).”
It continued to state that:
“For a small open economy like Luxembourg, this indicator is often overstressed because debt is overstressed and the GDP is undervalued because it does not take into account the added value created abroad.”
The liabilities of the financial sector is another indicator from the European Commission, expressed in annual growth percentages. The risk threshold stands at 16.5% growth.
Luxembourg has not crossed that threshold most years, except for 2003, 2005, 2006 and 2014. The report stated that the latest data shows that Luxembourg is now again just beneath that threshold.
Table: Growth rate of liabilities in the whole financial sector

Social aspects
The levels of people at risk of poverty after social benefits or social exclusion are still very much higher in 2016 than European Commission targets. 113,800 people were at risk of poverty or social exclusion in Luxembourg last year, or 16.5% of the population. Between 2008 and 2015, this represented an increase of 32%.
The percentage of people at risk of poverty while working stood at 11.5%, the third highest country out of 28.
Real unit labour costs have decreased (-1%) over the past three years.
Luxembourg is, on the other hand, 1st out of 20 in terms of net wealth per household at €768,000, 1st out of 28 in wage equality between men and women, and 1st in median income by purchasing power.
The Gini coefficient of inequalities has increased and stood at 31 in 2016, which is also the European average.
In 2015, 21.3% of households spent more than 25% of their income on housing.
Environmental aspects
Table: Rate of renewable energies in the final gross energy consumption (%)

Renewable energy represented about 5% of total consumption in 2015, against an EU average of 16.7%. Luxembourg had set itself an 11% objective by 2020, but is still far off it. Nevertheless, in energy efficiency the country has progressed, but efforts must be made to maintain the current levels.
Luxembourg had one of the lowest shares of renewable energy in gross energy consumption in the EU in 2015.
Luxembourg produced 12.7 tons of waste per head; in Germany, it was 4.7 tons, in Belgium 5.8 and in France 4.9 tons.
The rate of recycling of local waste was 48%.
27% of the land in Luxembourg is a protected zone, making it 6th in the ranking.
Luxembourg is 26th out of 28 in fuel and fuel products in final energy household consumption, at 34.1%.