
131,588 additional people were counted during the in November 2021. Luxembourg’s population growth is 15 times higher than that of the European Union. The EU population only increased by 1.7% between 2011 and 2021.
Fewer women than men
Compared to 2011, the share of women is slightly lower than that of men (49.6% women in 2021, compared to 50.2% in 2011). According to Statec, this trend has been observed since 2014, and is due to the migrant population, where men are slightly over-represented.
The ageing of the population continues with an average age of the population of 39.7 years, one year older than in 2011. Young people aged 0 to 19 are, in relative terms, becoming less numerous, while people aged 40 to 64 and those aged 80 and over are increasing in relative numbers.
For 2021, the upper half of the age pyramid is somewhat bell-shaped--there are few people at the top. From the top of the pyramid, the number of people increases gradually until it reaches the 35-39 age group (except for the 45-49 age group), which forms the base of the bell.
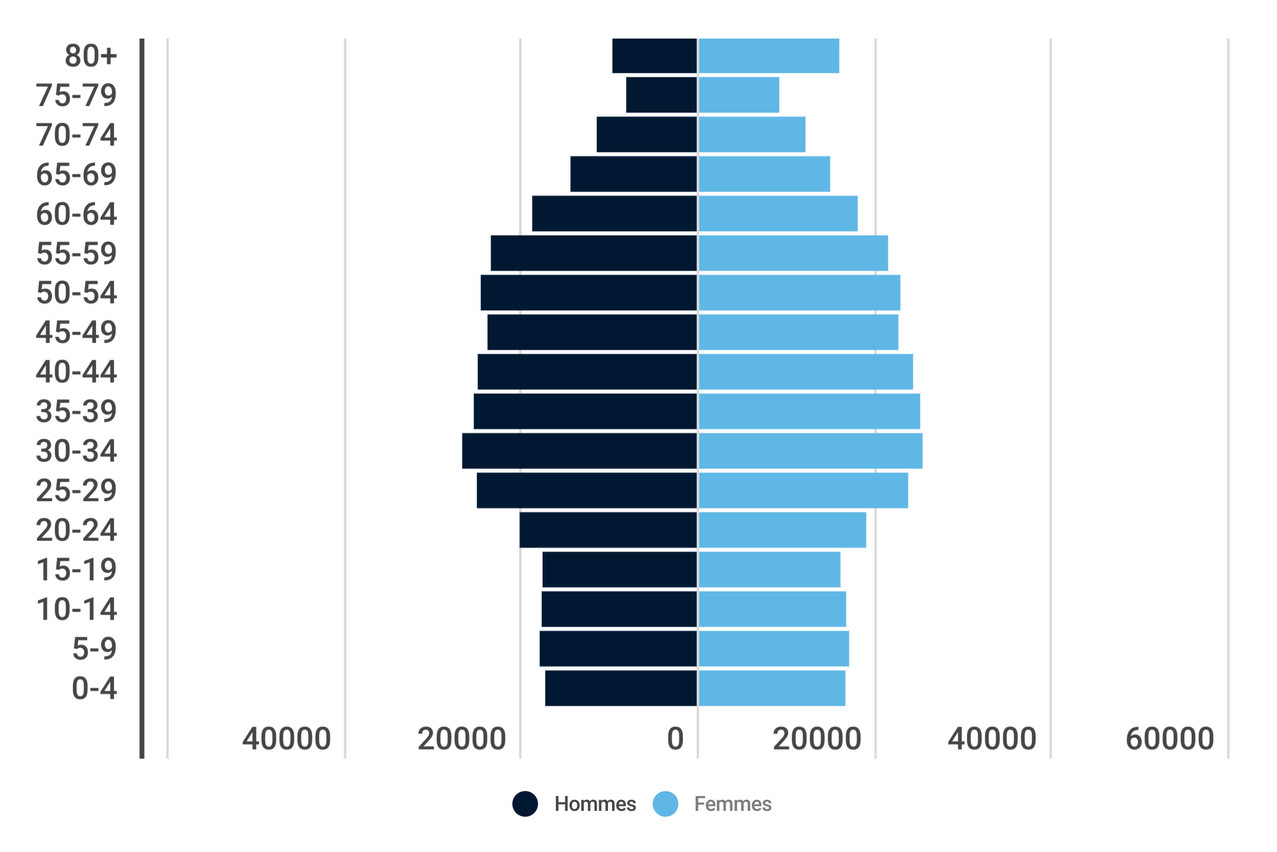
The age pyramid is more or less bell-shaped for 2021. Statec
From the age of 65 onwards, there are systematically more women than men, as women have a higher life expectancy.
Dependency ratio declining for two decades
When the first results of this census were presented, the focus was on the overall dependency ratio. This indicator is mainly used to understand the so-called economic burden resulting from the age structure.
The overall dependency ratio indicates how many inactive people are dependent on 100 active people. It considers under-15s and over-64s as inactive, and those between 15 and 64 years of age as being the active population.
According to the latest census, the old-age dependency ratio was 21.2% in 2021 (20.4% in 2011). In other words, in 2021, 21.2 people aged 65 and over depended on 100 active residents. This old-age dependency ratio has stagnated at around 20% since the 1970s.
In contrast, the dependency ratio of young people appears in the form of a wave: after peaking at around 34.3% in 1966, it dips temporarily to 25.3% in 1991 and rises again to a value of 28.2% in 2001. Since then, the ratio has fallen to 25.2% in 2011 and to 23% in 2021.
This story was first published in French on . It has been translated and edited for Delano.