An impulsive tweet that he regretted posting? Perhaps. But when asked, Verhofstadt did not comment on the meaning of his tweet of 2 January. His tweet was still accessible at the time of publication of this article.
In essence, he accused the European Union in general and Luxembourg in particular of having increased their imports of goods from Russia. And in a very large proportion for the grand duchy which, with €8bn imported goods from February to August, showed an increase of 262% in products bought in Moscow.
In his haste, he seems to have confused the volume and value of these exports. Nor did he even read the warning from the Politico website from which he drew his figures from an itself based on Eurostat figures. Politico was careful to specify that “trade with Russia has declined significantly as a result, though it’s still slightly higher in value than last year due to soaring energy and commodity prices.” If there was an increase, it was due to the rise in the price of raw materials exported by Russia, especially gas and oil.
The problem is that the thread of comments on the MEP's tweet gives voice to the opponents of the sanctions, who make the comment that Europe's efforts are useless.
Quarrel over numbers
Let's get back to the figures and to their source, Eurostat. On the trade front, from 2011 to 2021, imports and exports with Russia have decreased, the notes.
In 2021, Russia was the EU's fifth largest export partner for goods (4.1% of total volume). It was behind the US (18.3%), the UK (13%), China (10.2%) and Switzerland (7.2%). It was the EU's third biggest partner for imports of goods (7.5%), preceded by China (22.4%) and the United States (11.0%) and followed by the United Kingdom (6.9%) and Switzerland (5.9%).
The dynamism of trade with Russia is driven by Germany, which imports--or used to import--almost all of its gas from Russia in order to return industrial products manufactured with this 'cheap' energy. In 2021, 68% of EU imports were raw materials and only 19% were manufactured goods. And of the important raw materials, energy accounted for 62%.
In Luxembourg, according to the most recent data compiled by the Luxembourg Chamber of Commerce for Delano’s sister publication Paperjam, the dynamic is totally opposite to that shared by Verhofstadt.
Still using Eurostat figures, Regina Khvastunova, Russia expert at the Chamber of Commerce, and Nicolas Liebgott, junior economist at the Chamber of Commerce, note a 3% drop in linear value for Luxembourg for the period February-August 2022 compared to the same period last year, even though imports in volume for Luxembourg from Russia were already down by 31% between 2020 and 2021.
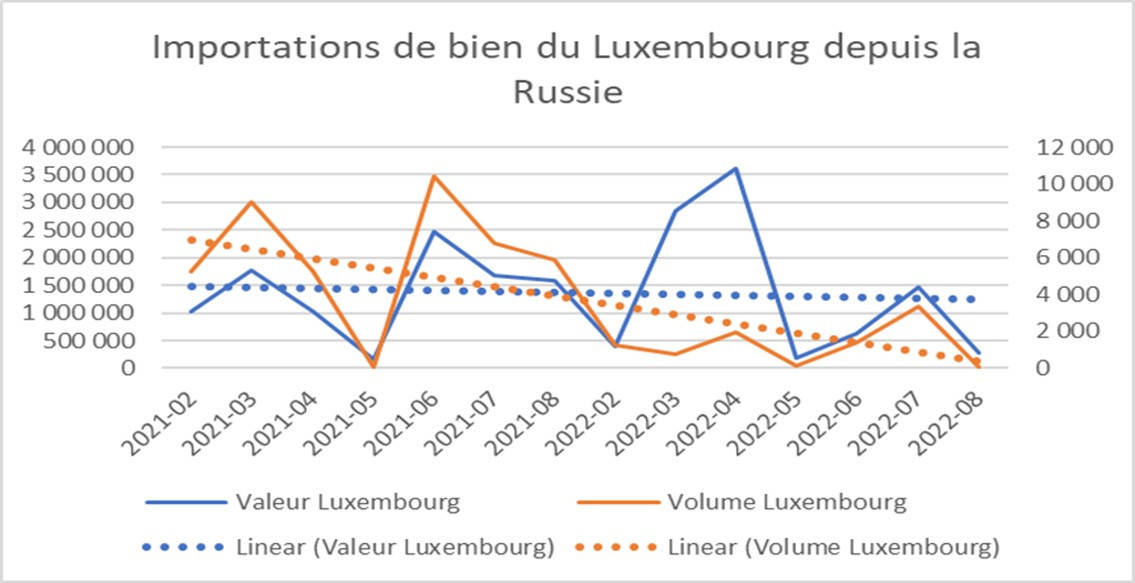
Russian goods imports to Luxembourg. Blue lines represent value and orange lines represent volume. Eurostat/Luxembourg Chamber of Commerce
For the EU, the two experts note a 56.27% increase in the value of imports over the period February-August 2022 compared with the same period in 2021. On the other hand, the volume of imports decreases by 23.63%. This increase in value is initially explained by a price effect, with imported inflation inflating the value of imports despite a fall in quantities. In addition, the reorganisation of supply sources--due in particular to the EU's heavy dependence on Russian gas and oil--is taking time.
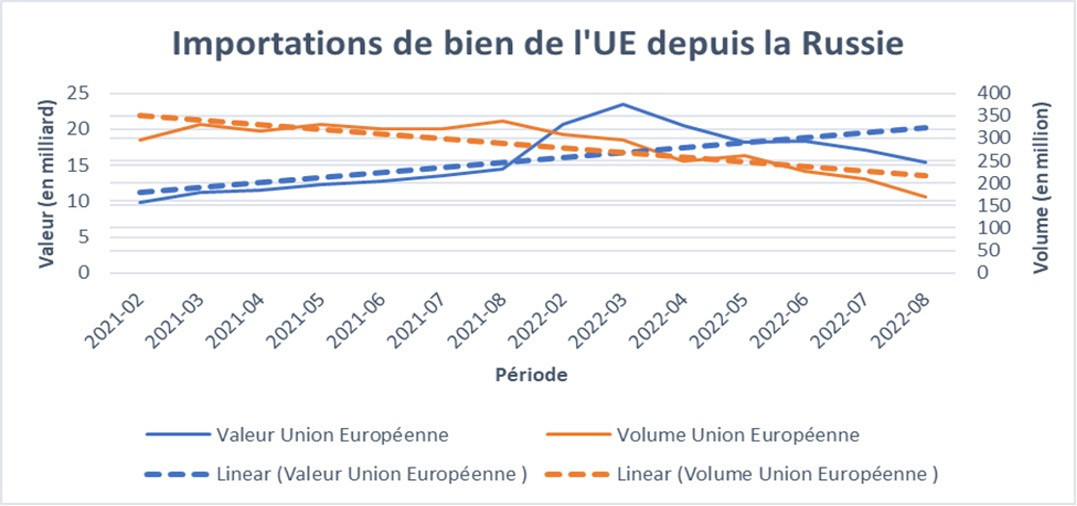
Russian goods imports into the EU. Blue lines represent value and orange lines represent volume. Eurostat/Luxembourg Chamber of Commerce
"Since mid-May 2022, however, the value of imports has tended to decline. Comparing the first five months of 2022 with the months of June to October 2022, there has been a sharp decline in the value of Russian imports into the EU (the value of Russian imports between June and October 2022 is down by 25% compared to the first five months of 2022)," stated Khvastunova and Liebgott. “The downward trend in the value of EU imports of goods from Russia is expected to increase with the new set of sanctions, namely the ban on Russia exporting its crude oil by sea to the EU since 5 December 2022--which accounts for about 90% of Russian oil exports to the EU--as well as the capping of the price of Russian oil at $60 per barrel decided by the G7 countries, Australia and the EU."
Originally published in French by and translated for Delano.