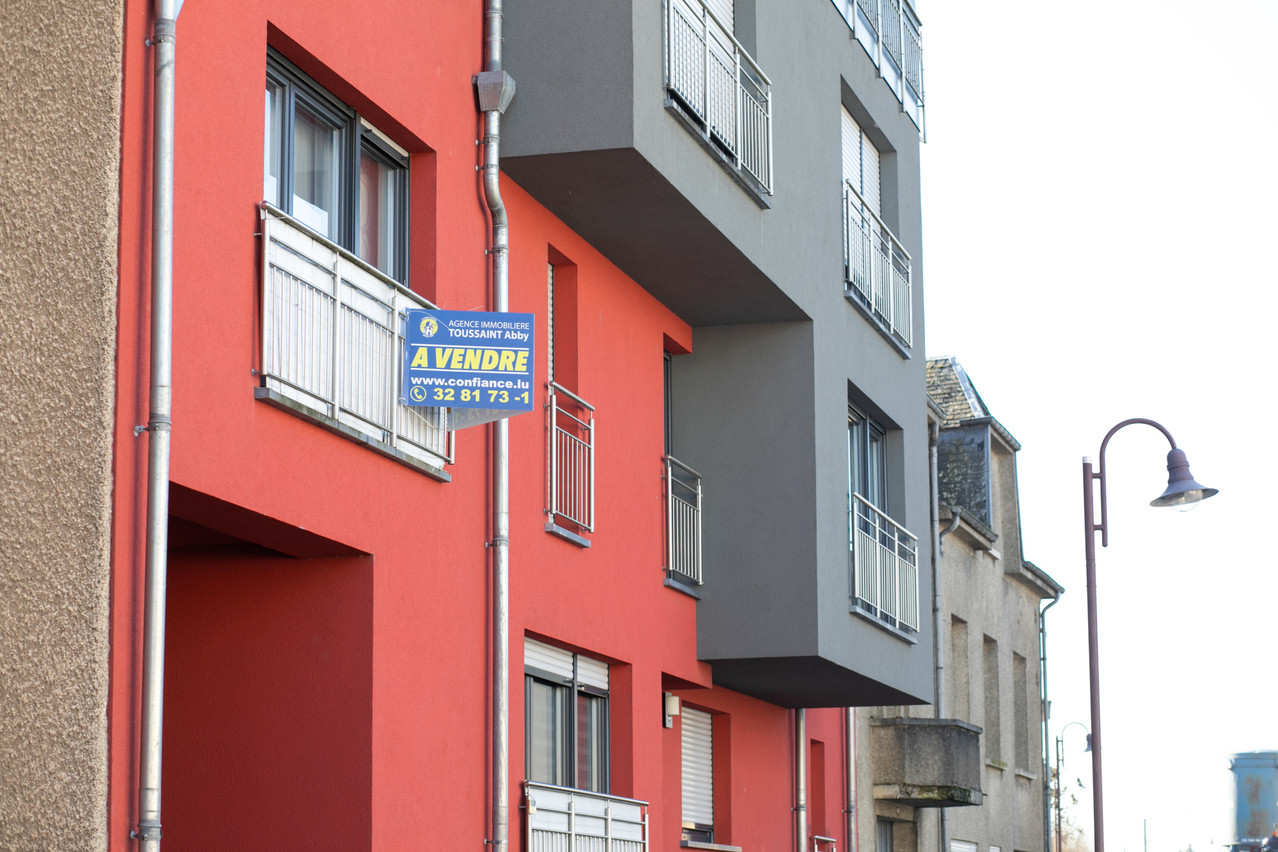
The first data dashboard in the series focuses on the history of listing prices for newly built and existing apartments, by municipality.
“In Luxembourg, the increase in apartment prices over the last ten years is really impressive,” according to Steve Albrecht at Luxdata.
Luxdata’s “analysis of average prices shows the high and low range of sale prices. Although featuring indicative values, these are very interesting insights into the price ranges per square meters.”
“This dashboard analyses the number of actual sales and recorded price range of apartments by municipality,” Albrecht stated. “The recorded trend of the average over the last years gives a strong indication of the level of increase--literally double since 2015!”
The rapid rise in valuations has been “great news” for existing homeowners, but “difficult news for those wanting to buy” now, Albrecht observed.
“While the price range is interesting, it does not allow to provide additional insight because the related sizes of the apartments is not provided in this dataset.”
